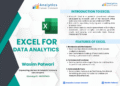
📊 Download Free PDF: Excel for Data Analysis
Looking to master Excel for Data Analytics? We’ve prepared a comprehensive PDF guide that walks you through everything you need — from the basics of Excel to advanced data analysis techniques.
Whether you are a beginner or an experienced professional, this guide will help you unlock Excel’s full potential for managing, analyzing, and visualizing data.
📘 What’s Inside the PDF?


Here’s the complete index of topics covered:
- Introduction to Excel
Learn the foundations of Excel and why it’s the most widely used tool for data analysis. - Features of Excel
Discover the essential functions that make Excel a powerful tool for professionals. - Features in Excel
A deeper dive into advanced capabilities and hidden gems you may not know about. - Data Manipulation in Excel
Clean, organize, and transform raw data into meaningful insights. - Data Visualization
Create impactful charts and graphs that tell the story behind the numbers. - Pivot Tables in Excel
Master pivot tables to summarize and explore your datasets with ease. - Data Analytics Tool in Excel
Explore built-in analysis tools for statistical and business insights. - Excel Macros
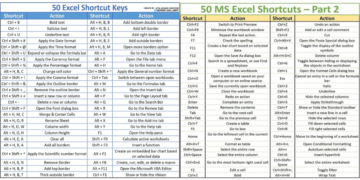
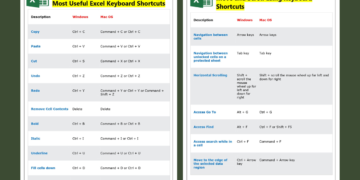
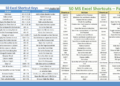
Automate repetitive tasks and increase productivity with macros. - Shortcut & Tips in Excel
Save time and work smarter with professional tips and keyboard shortcuts.
🎯 Why Download This PDF?
- Easy-to-follow explanations with practical examples
- Covers both fundamentals and advanced techniques
- Perfect for students, professionals, and business users
- Helps you improve decision-making through data
The Excel Data Analysis Workflow, Step by Step
Whatever the dataset (sales, survey answers, website traffic or HR records), good analysis in Excel follows the same five stages. Use this as a checklist alongside the PDF.
1. Import and clean the data
- Get data with Power Query (Data › Get Data). It imports CSV files, folders, databases and web tables, and it records every cleaning step so you can refresh next month with one click.
- Remove duplicates (Data › Remove Duplicates) and blank rows.
- Fix text with
=TRIM()for stray spaces,=PROPER()for consistent capitalisation and Flash Fill (Ctrl + E) to split or combine columns by example. - Convert text to numbers and dates with Text to Columns or
=VALUE()and=DATEVALUE().
2. Structure it as an Excel Table
Select the data and press Ctrl + T. Tables expand automatically, keep formatting consistent, and let you write readable formulas such as =SUM(Sales[Amount]). One header row, one record per row and no merged cells is the rule that makes everything else work.
3. Summarise with PivotTables
PivotTables (Insert › PivotTable) are the fastest way to answer “how much, how many, by what”. Drag a category to Rows, a date to Columns and an amount to Values, then:
- Group dates by month, quarter or year (right-click › Group).
- Change “Sum” to “Count”, “Average” or “% of Grand Total” in Value Field Settings.
- Add Slicers (PivotTable Analyze › Insert Slicer) for one-click filtering.
4. Analyse with formulas
| Question | Formula |
|---|---|
| Total sales for one region and month | =SUMIFS(Sales[Amount],Sales[Region],"East",Sales[Month],"Jan") |
| How many orders above 1,000? | =COUNTIFS(Sales[Amount],">1000") |
| Bring in the product price from another table | =XLOOKUP([@Product],Products[Name],Products[Price]) |
| List all orders from one customer | =FILTER(Sales,Sales[Customer]="Acme") |
| List each region once | =UNIQUE(Sales[Region]) |
| Rank values | =RANK.EQ([@Amount],[Amount]) |
5. Go deeper with statistics
Enable the free Analysis ToolPak (File › Options › Add-ins › Excel Add-ins › Analysis ToolPak). It adds Data › Data Analysis with:
- Descriptive Statistics: mean, median, standard deviation, min, max and more in one table.
- Histogram: the distribution of a variable.
- Correlation: how strongly variables move together.
- Regression: how much one variable explains another, with R² and coefficients.
For quick checks you can also use =CORREL(range1,range2), =STDEV.S(range) and =MEDIAN(range).
6. Visualise and share
- Use conditional formatting (data bars, colour scales) to make tables readable.
- Choose the right chart: line for trends over time, column for comparing categories, scatter for relationships. Our guide on which chart to use when explains each type.
- Combine PivotCharts and slicers on one sheet for a simple interactive dashboard.
Frequently Asked Questions
Is Excel enough to become a data analyst?
Excel is the most common first tool for data analysts and is used in almost every analyst job. Most roles also expect SQL, and many ask for Power BI or Tableau, but strong Excel skills (PivotTables, lookups, Power Query and charts) are the foundation.
What is the difference between Power Query and PivotTables?
Power Query prepares the data: it imports, cleans and reshapes it. PivotTables summarise the prepared data. In a good workflow, Power Query feeds a Table and PivotTables are built on top of it.
Which version of Excel do I need?
Everything in this guide works in Microsoft 365. Dynamic array functions such as FILTER and UNIQUE need Excel 2021 or Microsoft 365, while PivotTables, Power Query and the Analysis ToolPak are also available in Excel 2016 and 2019.
Related guides
- 20 Essential Excel Formulas for Data Analysts
- 5 Excel Features Every Data Analyst Should Know
- Data Analysis by MS Excel PDF
- Microsoft Excel and Business Data Analysis PDF
📥 Download the PDF Now
👉 Click here to download Excel for Data Analysis (PDF)
Start learning today and take your data analysis skills to the next level!