Introduction
Charts are indispensable tools for data visualization, helping us interpret complex data sets efficiently. Whether you’re a business analyst, educator, or researcher, understanding different types of chart can significantly enhance your data presentation skills. To assist you in mastering this, we have created a comprehensive PDF document titled ‘Types of Chart and Which One When?’ available for download.
Overview of the Document
The document offers an in-depth look at various types of chart, detailing their features, advantages, and ideal usage scenarios. From basic bar charts to more intricate radar charts, this guide covers it all. Each type of chart is explained with clear examples and visuals, ensuring you grasp the concepts quickly.
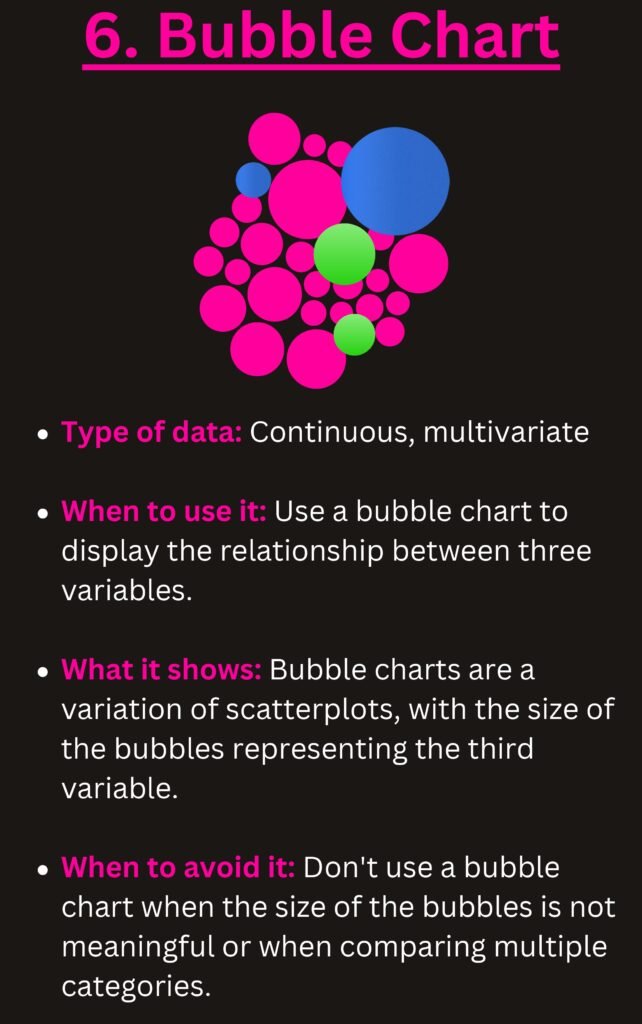
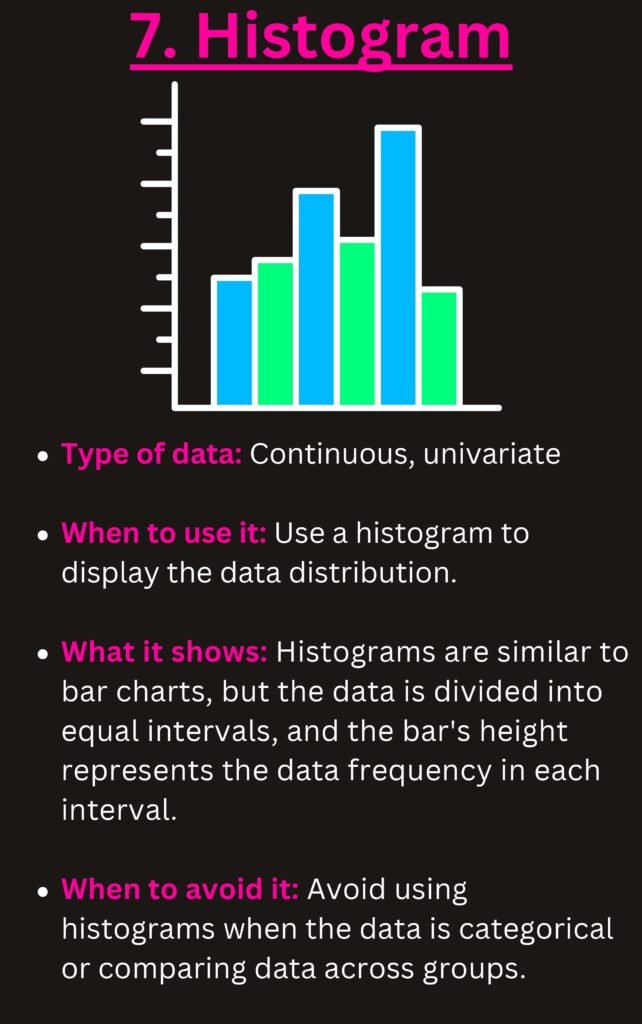
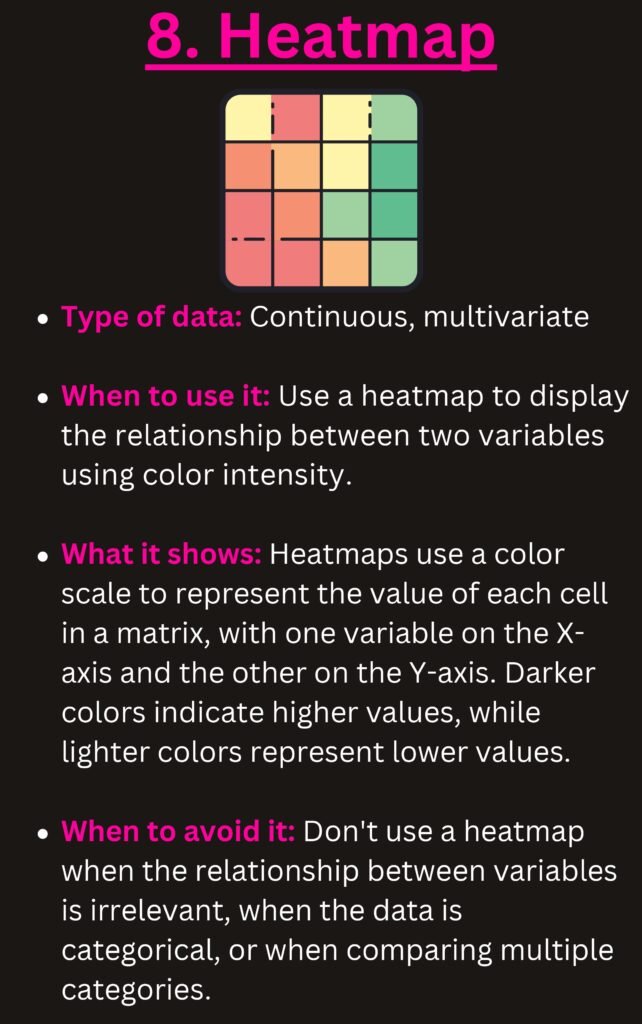
The Content
Our PDF document is segmented into easy-to-follow sections:
1. **Introduction to Data Visualization** – Understand the importance of visualizing data effectively.
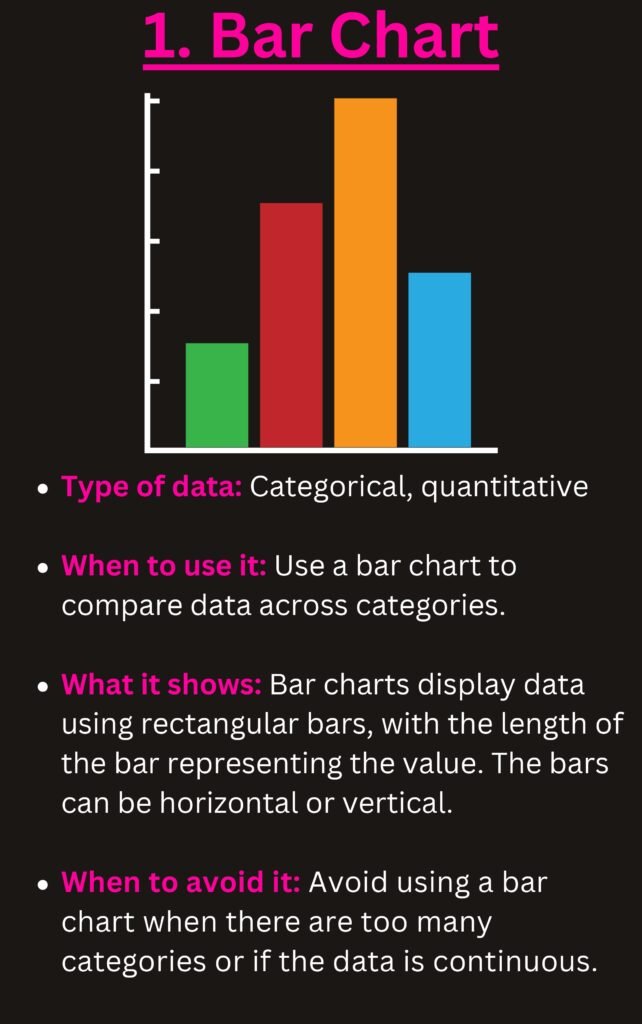
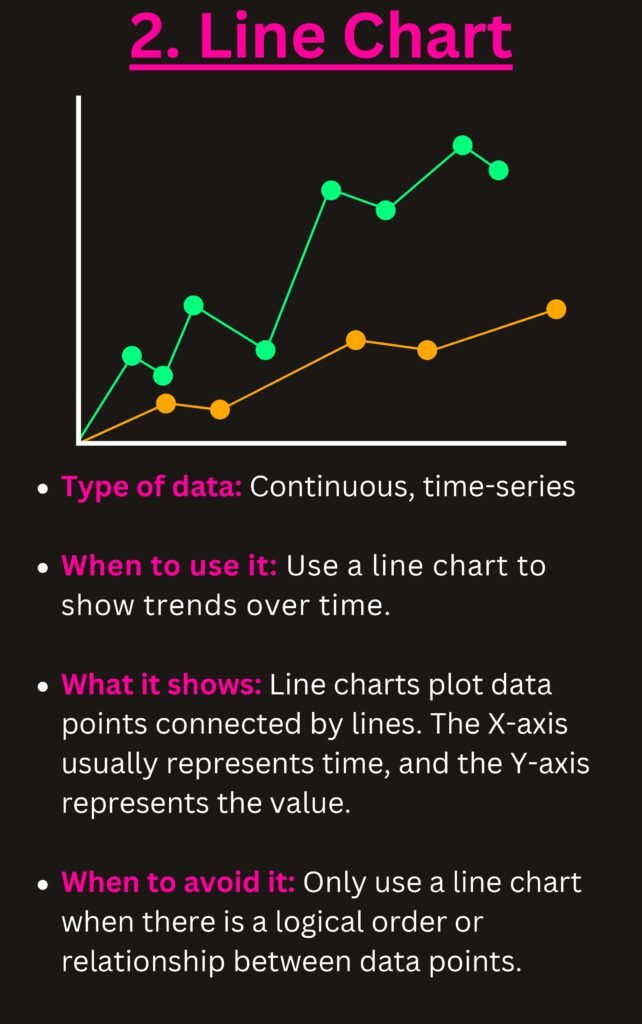
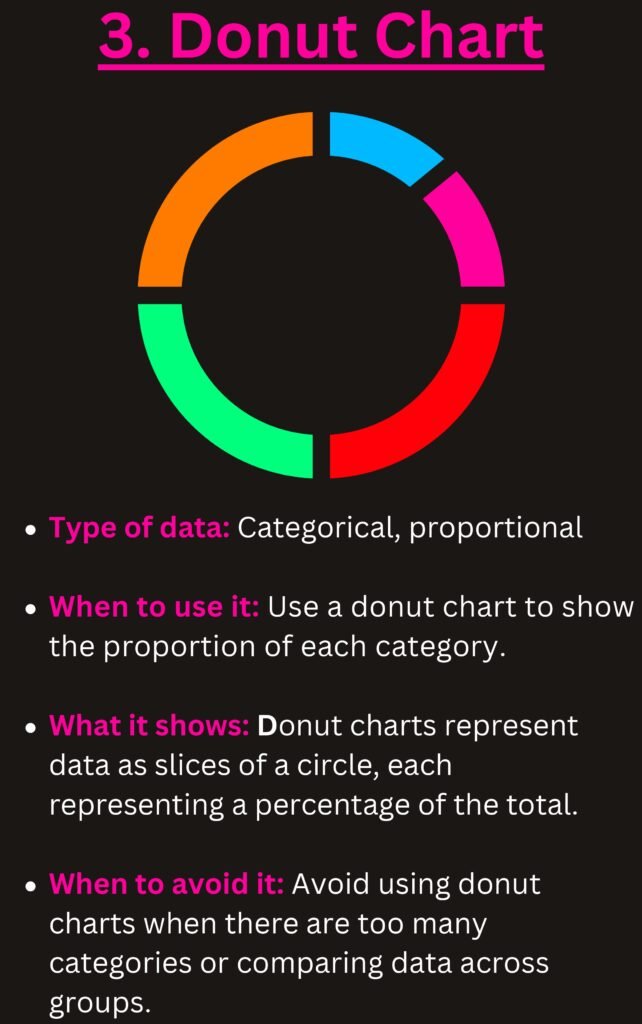
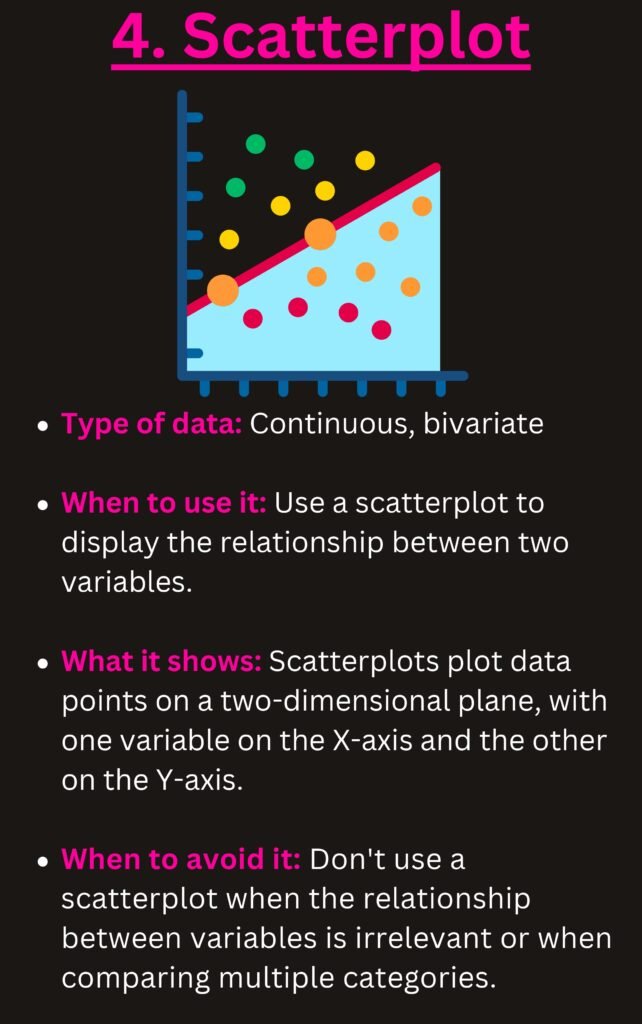
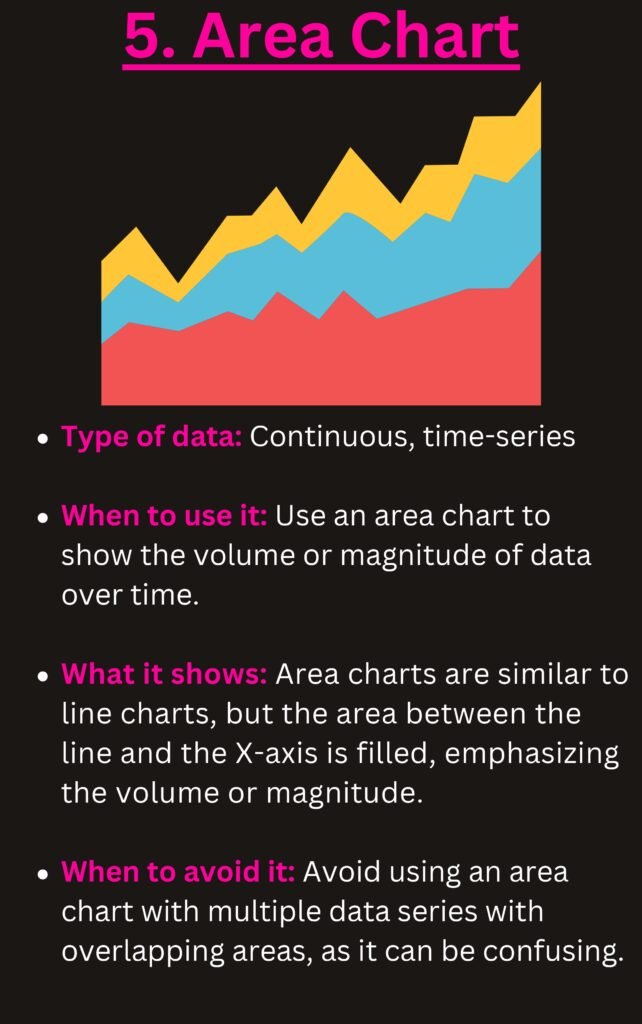
2. **Types of Chart** – Detailed descriptions of different charts such as bar charts, pie charts, line charts, scatter plots, and more.
3. **When to Use Each Chart** – Learn the specific scenarios where each chart type excels.
4. **Common Mistakes** – Avoid common pitfalls in data visualization.
Why the Document
This document serves as a go-to resource for anyone looking to improve their data visualization skills. The detailed explanations and practical examples make it suitable for both beginners and seasoned professionals. By understanding the types of chart and when to use them, you can make your data presentations more impactful and informative.
Which Chart Should You Use? A Quick Chart Chooser
The PDF explains each chart type in detail. Use the table below as a fast decision guide: start from the question you want your chart to answer, not from the chart you like best.
| Your question | Best chart | Avoid |
|---|---|---|
| How did a value change over time? | Line chart (column chart for few periods) | Pie chart |
| How do categories compare? | Clustered bar or column chart, sorted largest to smallest | 3-D columns |
| What is the share of the whole? | Pie or doughnut (max. 5 slices) or 100% stacked bar | Pie with many tiny slices |
| How do parts add up over time? | Stacked column or stacked area | Multiple pies side by side |
| How does a starting value become an ending value? | Waterfall chart | Plain column chart |
| Is there a relationship between two variables? | Scatter plot (add a trendline) | Line chart |
| How are values distributed? | Histogram or box & whisker | Pie chart |
| How do actual results compare with a target? | Bullet-style bar or column with a target line | Gauge charts |
| Where are the values on a map? | Filled map chart | Tables of country names |
How to create the most useful charts in Excel
- Select your data, including the header row.
- Press Alt + F1 for a quick default chart, or go to Insert › Recommended Charts to see Excel’s suggestions.
- Change the type with Chart Design › Change Chart Type. For actual-vs-target, choose Combo and set the target series as a line.
- Add a waterfall chart from Insert › Insert Waterfall, Funnel, Stock, Surface or Radar Chart (Excel 2016 and later).
- Use Insert › Charts › Histogram or Box and Whisker for distributions.
Chart design rules that make data easier to read
- One message per chart. Write that message as the chart title, e.g. “Online sales overtook stores in Q3”.
- Sort bars from largest to smallest unless the categories have a natural order (months, age groups).
- Start bar and column axes at zero; truncated axes exaggerate differences.
- Remove clutter: gridlines you don’t need, legends you can replace with direct labels, 3-D effects and shadows.
- Use colour with purpose: grey for context, one accent colour for the series that matters.
- Label directly where possible instead of making readers match colours to a legend.
Dynamic charts that update automatically
Build charts on an Excel Table (Ctrl + T) and they expand when you add new rows. For interactive dashboards, build PivotCharts and add Slicers so viewers can filter by region, product or year with one click.
Frequently Asked Questions
What is the difference between a bar chart and a column chart?
They show the same thing. Column charts use vertical bars and work well for time periods; bar charts use horizontal bars and are better when category names are long.
When should I not use a pie chart?
Avoid pie charts when you have more than five categories, when values are close in size, or when you need to compare across several periods. A sorted bar chart is easier to read in all of these cases.
Which chart is best for showing trends?
A line chart. It makes the direction and speed of change obvious, and it handles many time periods better than columns.
Related guides
- Excel for Data Analysis PDF
- 5 Excel Features Every Data Analyst Should Know
- Financial Analysis Using Excel PDF
Conclusion
In an era where data is king, the ability to present it clearly and effectively is invaluable. Our PDF guide ‘Types of Chart and Which One When?’ is designed to help you achieve just that. Whether you are presenting to stakeholders or analyzing trends, this guide will be your trusted companion.
Download PDF
Download the PDF now and start making your data work for you!