Introduction
In the rapidly evolving field of data analysis, proficiency in Excel is more important than ever. This blog post introduces a comprehensive PDF document designed to help data analysts master key Excel features. These features not only streamline your workflow but also enable more insightful data manipulation and analysis.
Overview of the Document
The PDF document, titled ‘5 Excel Features Every Data Analyst Should Know,’ serves as an essential guide for both new and experienced data analysts. It meticulously covers five critical Excel features that are indispensable in the realm of data analysis. Each feature is explained in detail, along with practical examples that demonstrate their real-world applications.


The Content
The document delves into the following Excel features:
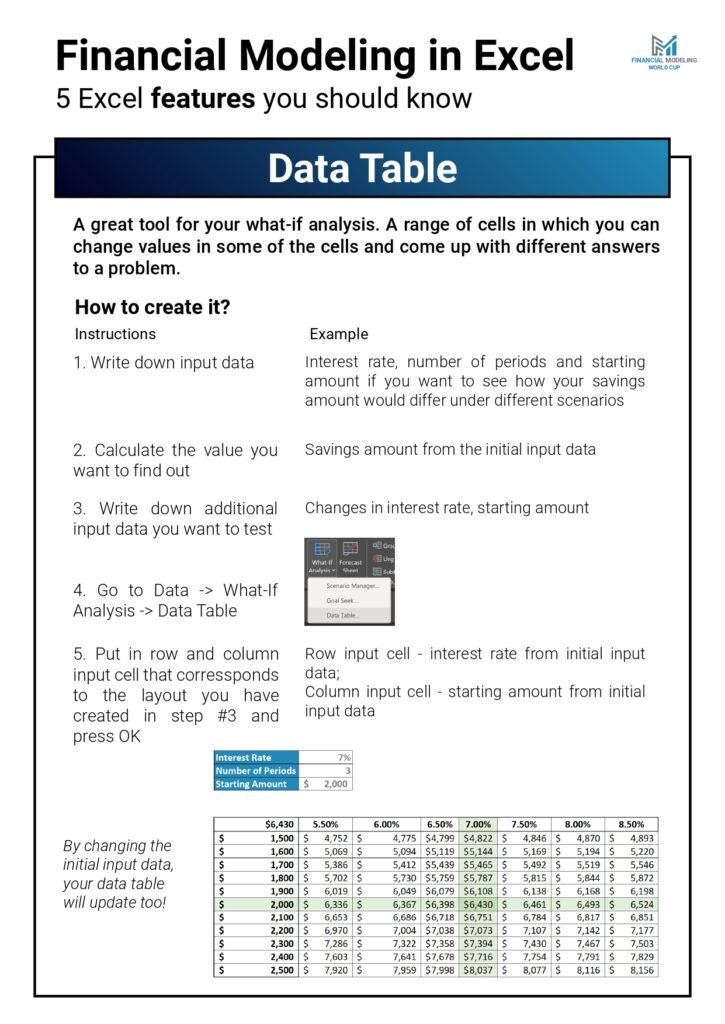
1. Data Table: A great tool for your what-if analysis. A range of cells in which you can change values in some of the cells and come up with different answers to a problem.
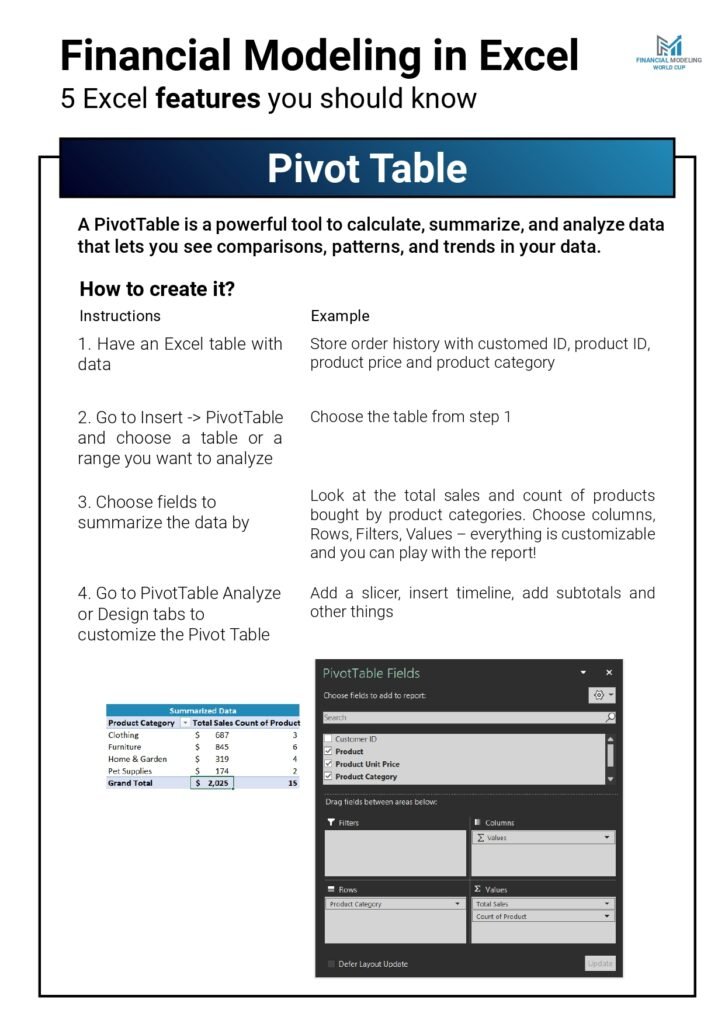
2. Pivot Tables: A PivotTable is a powerful tool to calculate, summarize, and analyze data that lets you see comparisons, patterns, and trends in your data.
3. Data Validation: Use data validation to restrict the type of data or the values that users enter into a cell. One of the most common data validation uses is to create a drop-down list.
4. Power Query: Power Query (known as Get & Transform in Excel) is a great tool for minimizing repetitive daily tasks. You can import or connect to external data and then shape this data. For example, remove a column, change a data type, or merge tables in ways that meet your needs. Then, you can load your query into Excel to create charts and reports.
5. Group Data: If you have a list of data you want to group and summarize, you can create an outline of up to eight levels. Very important for financial models to switch between different levels of data complexity. Group data instead of hiding rows/columns!
Why the Document
This document is not just a list of Excel features; it is a practical guide aimed at enhancing your data analysis skills. Whether you’re dealing with large datasets or performing complex calculations, these Excel features will significantly improve your productivity and accuracy. The PDF provides clear, step-by-step instructions, making it easy to follow and implement these features in your daily work.
The 5 Features in Practice: Mini Tutorials
The PDF explains why these features matter. Here is a short, hands-on tutorial for each, so you can try them on your own data in a few minutes.
1. Data Tables: see many what-if results at once
Suppose B1 is the price, B2 the units sold and B3 the profit formula =B1*B2-20000.
- In E2:E6 list prices to test (40, 45, 50, 55, 60) and in F1:J1 list unit volumes (400, 500, 600, 700, 800).
- In E1 type
=B3so the table knows which result to show. - Select E1:J6, go to Data › What-If Analysis › Data Table, set Row input cell = B2 and Column input cell = B1.
Excel fills the grid with profit for every price/volume combination. For example, price 50 × 500 units shows 5,000. Add a colour scale to make break-even points jump out.
2. PivotTables: summarise thousands of rows in seconds
- Click inside your data (ideally an Excel Table) and choose Insert › PivotTable.
- Drag Region to Rows, Year to Columns and Sales to Values.
- Right-click a number › Show Values As › % of Row Total to see the mix.
- Add a Slicer for Product to filter with one click.
Remember to Refresh (Alt + F5) after the source data changes.
3. Data Validation: stop bad data at the door
- Select the input cells, then Data › Data Validation.
- Choose List and point the Source to a range of allowed values (e.g. a Table of departments) for a drop-down.
- Use Whole number or Date with limits for numeric inputs, and fill in the Error Alert tab with a helpful message.
To find existing bad entries, use Data › Data Validation › Circle Invalid Data.
4. Power Query: clean once, refresh forever
- Data › Get Data › From File › From Folder to combine every monthly CSV in a folder.
- In the Power Query Editor, remove unneeded columns, set data types, trim text and filter out blank rows. Every step is recorded on the right.
- Close & Load to a Table.
Next month, drop the new file in the folder and click Refresh All: all the cleaning steps run again automatically.
5. Conditional Formatting: let the important numbers stand out
- Highlight rules: values above target in green, below in red.
- Data bars inside cells for quick visual comparison.
- Formula-based rules for anything custom, e.g. highlight the whole row of overdue orders with
=$F2<TODAY()applied to A2:H500.
Keep it restrained: if everything is coloured, nothing stands out.
Frequently Asked Questions
What is the difference between a Data Table and an Excel Table?
An Excel Table (Ctrl + T) is a formatted range for storing data. A Data Table (What-If Analysis) is a sensitivity tool that recalculates a formula for many input values. The names are similar, but they do completely different jobs.
Is Power Query available in my Excel version?
Yes for Excel 2016 and later on Windows (as Get & Transform), and in Microsoft 365 on Mac with a slightly smaller feature set. Excel 2010 and 2013 needed a free add-in.
Related guides
- Excel for Data Analysis PDF
- Excel Formulas to Become a Data Analyst PDF
- 20 Essential Excel Formulas for Data Analysts
Conclusion
Excel is a powerful tool for data analysts, and mastering its features can give you a significant edge in your career. The ‘5 Excel Features Every Data Analyst Should Know’ PDF is an invaluable resource that will help you harness the full potential of Excel. By incorporating these features into your workflow, you’ll be better equipped to handle data analysis tasks with greater efficiency and precision.
Download PDF
Ready to elevate your data analysis skills? Download the ‘5 Excel Features Every Data Analyst Should Know‘ PDF now and start leveraging the power of Excel in your data analysis journey.