Introduction
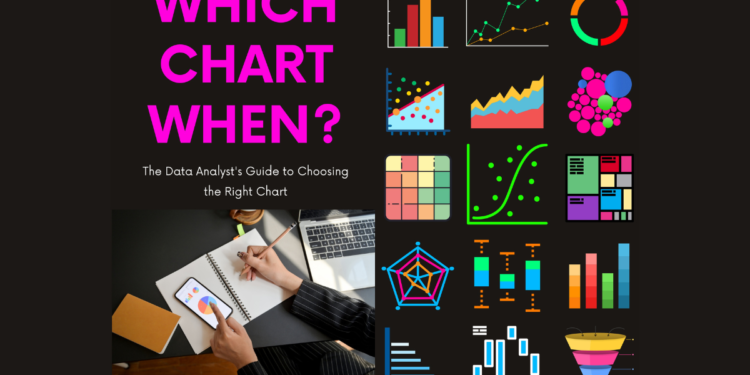
Charts are indispensable tools for data visualization, helping us interpret complex data sets efficiently. Whether you’re a business analyst, educator, or researcher, understanding different types of chart can significantly enhance your data presentation skills. To assist you in mastering this, we have created a comprehensive PDF document titled ‘Types of Chart and Which One When?’ available for download.
Overview of the Document
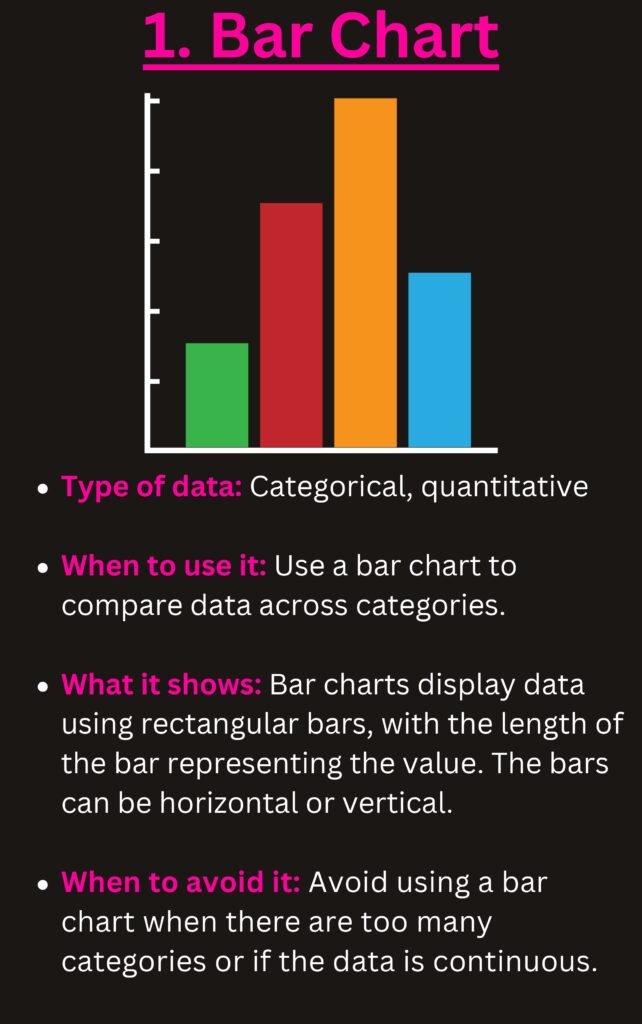
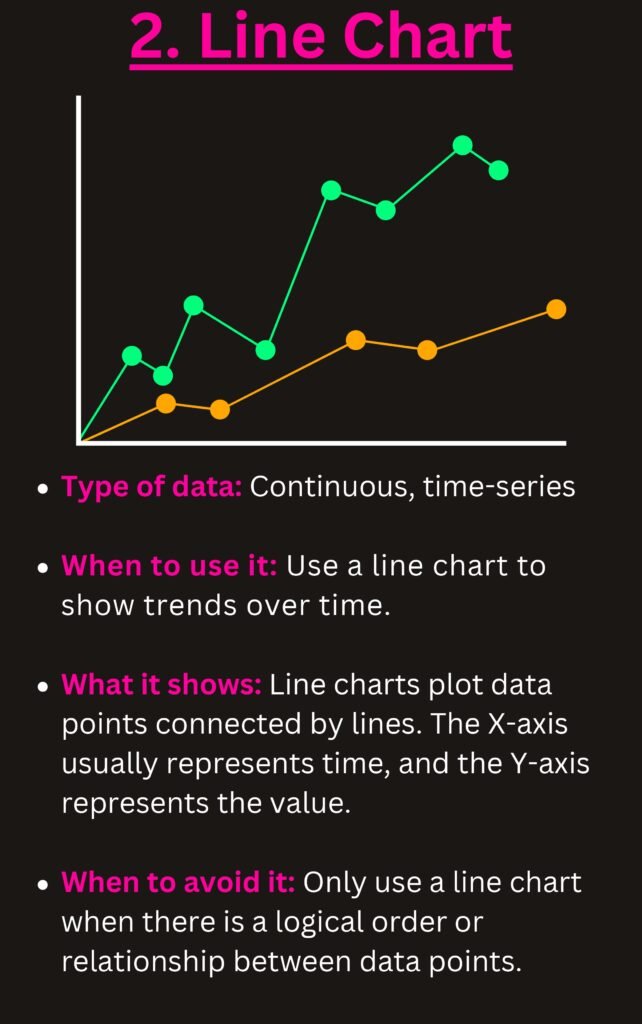
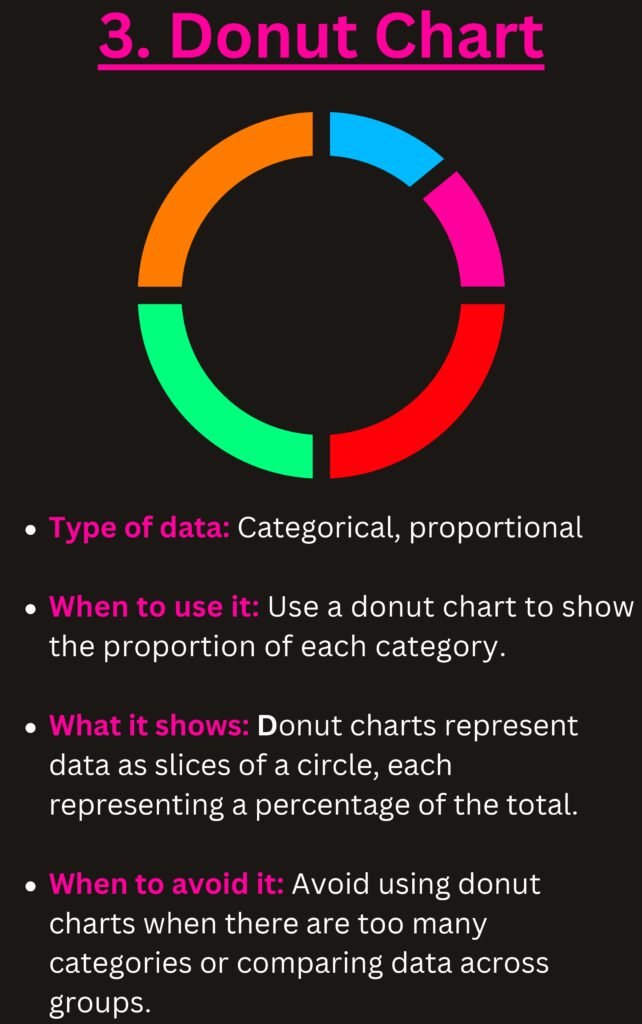
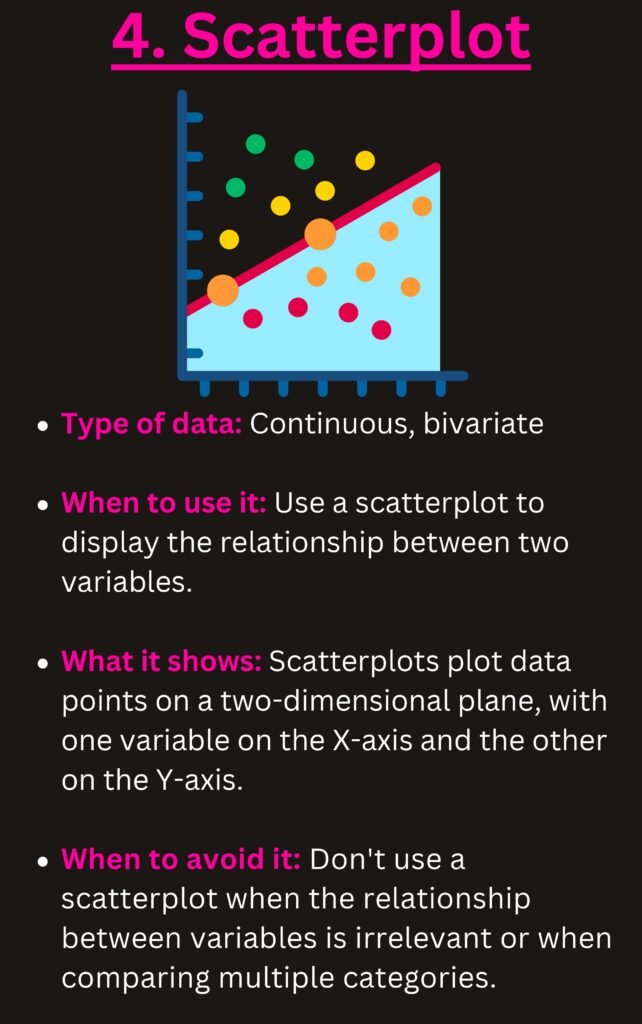
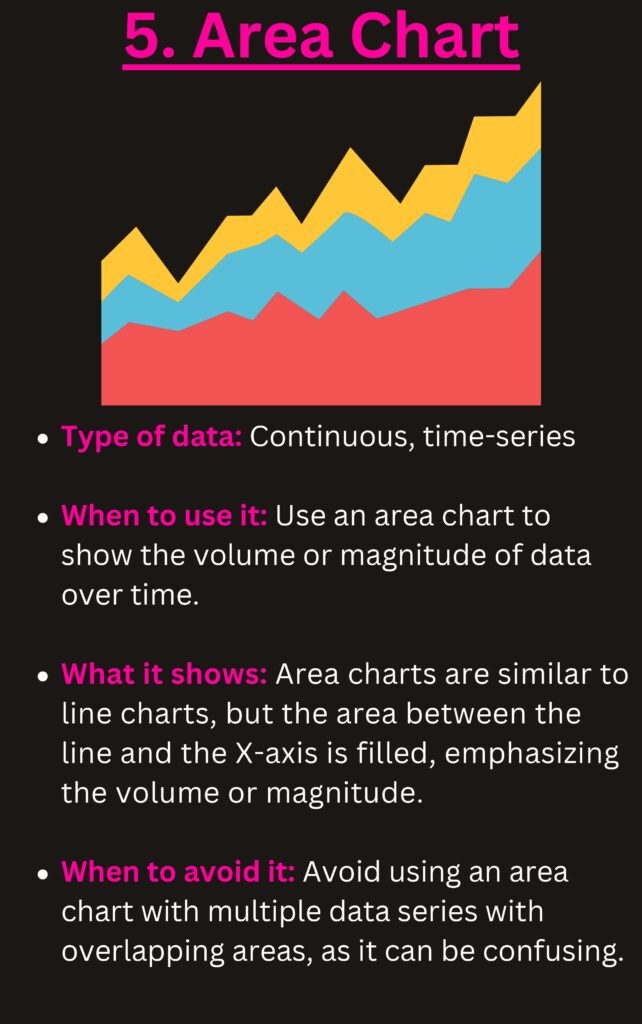
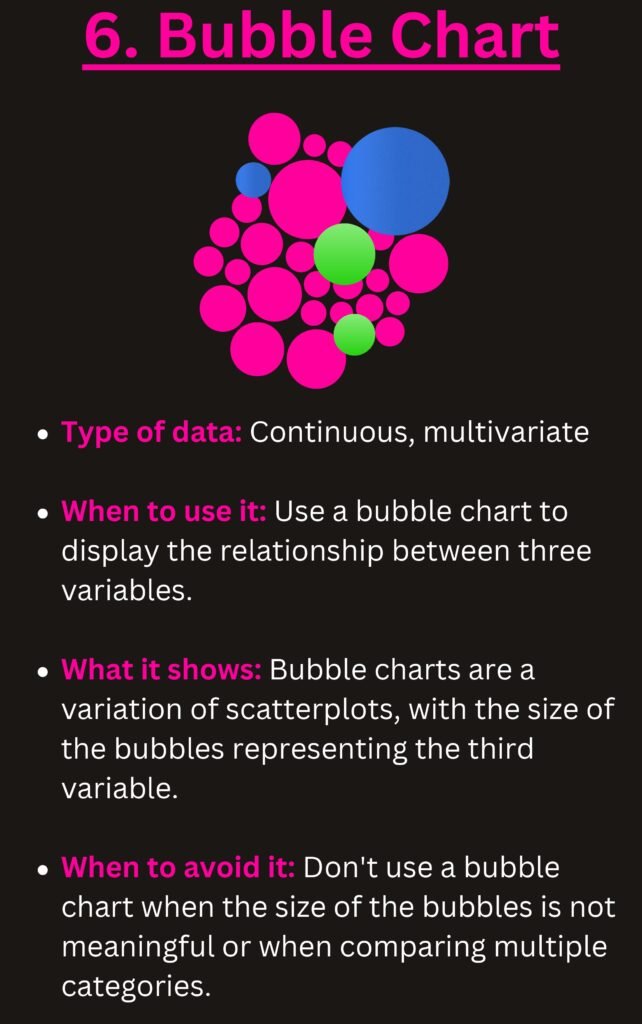
The document offers an in-depth look at various types of chart, detailing their features, advantages, and ideal usage scenarios. From basic bar charts to more intricate radar charts, this guide covers it all. Each type of chart is explained with clear examples and visuals, ensuring you grasp the concepts quickly.
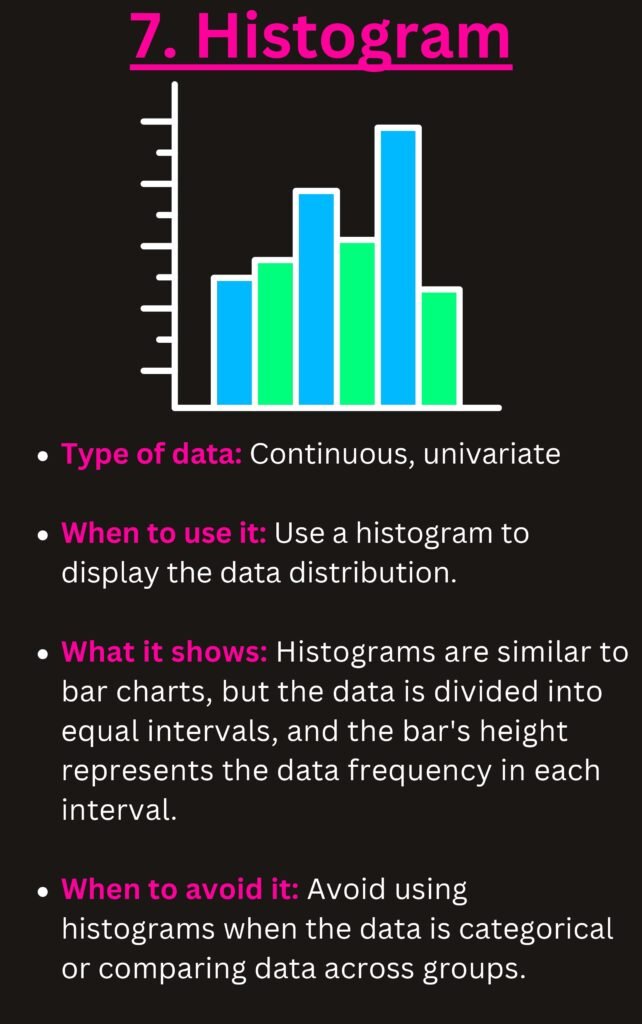
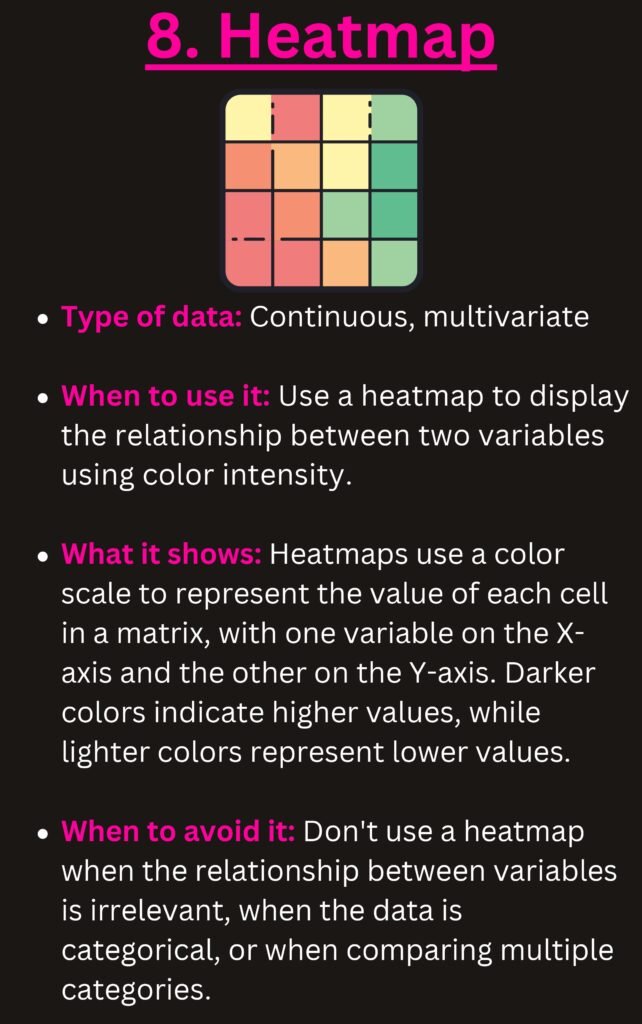
The Content
Our PDF document is segmented into easy-to-follow sections:
1. **Introduction to Data Visualization** – Understand the importance of visualizing data effectively.
2. **Types of Chart** – Detailed descriptions of different charts such as bar charts, pie charts, line charts, scatter plots, and more.
3. **When to Use Each Chart** – Learn the specific scenarios where each chart type excels.
4. **Common Mistakes** – Avoid common pitfalls in data visualization.
Why the Document
This document serves as a go-to resource for anyone looking to improve their data visualization skills. The detailed explanations and practical examples make it suitable for both beginners and seasoned professionals. By understanding the types of chart and when to use them, you can make your data presentations more impactful and informative.
Conclusion
In an era where data is king, the ability to present it clearly and effectively is invaluable. Our PDF guide ‘Types of Chart and Which One When?’ is designed to help you achieve just that. Whether you are presenting to stakeholders or analyzing trends, this guide will be your trusted companion.
Download PDF
Download the PDF now and start making your data work for you!


