Introduction
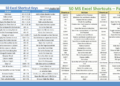
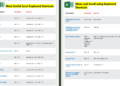
In the realm of finance, proficiency with tools like Excel is indispensable. Whether you are a professional or a student, mastering financial analysis using Excel can boost your productivity and decision-making skills. In this post, we are excited to introduce a comprehensive PDF document dedicated to financial analysis using Excel.
Overview of the Document
Our PDF is tailored for ease of understanding, providing step-by-step instructions on leveraging Excel for financial analysis.


The guide covers everything from basic formulas to advanced data modeling techniques. Its structured approach ensures that you can follow along, irrespective of your prior experience.
The Content
The document is divided into several key sections, including:
– Introduction to Financial Analysis
– Essential Excel Functions
– Financial Ratios and Metrics
– Creating Financial Models
– Analyzing Financial Statements
Each section delves into detailed examples and practical applications, ensuring a hands-on learning experience. Screenshots and diagrams further enhance the clarity of explanations.
Why the Document?
This PDF document stands out for its comprehensive approach and ease of use. It’s designed to cater to both beginners and seasoned professionals. By using this guide, you can significantly enhance your ability to perform intricate financial analyses with Excel. The practical insights offered can help you make better-informed business decisions, saving you time and effort.
How to Do Financial Analysis in Excel: A Practical Walkthrough
The PDF gives you the full method. This section summarises the core techniques with ready-to-use Excel formulas, so you can start analysing a set of financial statements today.
Step 1: Set up clean financial statements
Put the income statement and balance sheet on one sheet with years in columns and line items in rows. Keep raw numbers only (no merged cells, no text inside number cells) and convert the range to an Excel Table with Ctrl + T so formulas and charts extend automatically when you add a year.
Step 2: Horizontal analysis (growth over time)
Horizontal analysis compares each line item with the previous period.
- Year-over-year growth:
=(C5-B5)/B5, formatted as a percentage. - Compound annual growth rate (CAGR):
=(End/Start)^(1/Years)-1, or the built-in=RRI(Years,Start,End).
Example: revenue grows from 1,200 to 1,452 over two years. CAGR = (1,452 ÷ 1,200)1/2 − 1 = 10% a year. =RRI(2,1200,1452) returns the same 10%.
Step 3: Vertical analysis (common-size statements)
Vertical analysis expresses every line as a percentage of a base figure: revenue for the income statement, total assets for the balance sheet. With revenue in row 5, use =B8/B$5 and copy down and across. The $ locks the row so every line divides by revenue. Common-size statements make it easy to compare companies of very different sizes.
Step 4: Ratio analysis
| Ratio | Formula | What it tells you |
|---|---|---|
| Gross margin | Gross profit ÷ Revenue | How much is left after direct costs |
| Operating margin | Operating profit (EBIT) ÷ Revenue | Efficiency of the core business |
| Net margin | Net income ÷ Revenue | Profit kept from each unit of sales |
| Return on equity (ROE) | Net income ÷ Average shareholders’ equity | Return generated for owners |
| Return on assets (ROA) | Net income ÷ Average total assets | How well assets produce profit |
| Current ratio | Current assets ÷ Current liabilities | Short-term liquidity |
| Quick ratio | (Current assets − Inventory) ÷ Current liabilities | Liquidity without relying on stock |
| Debt-to-equity | Total debt ÷ Shareholders’ equity | Financial leverage |
| Interest coverage | EBIT ÷ Interest expense | Ability to pay interest |
| Asset turnover | Revenue ÷ Average total assets | Sales generated per unit of assets |
| Days sales outstanding | Receivables ÷ Revenue × 365 | How fast customers pay |
| Inventory days | Inventory ÷ Cost of sales × 365 | How long stock sits before it is sold |
Tip: wrap ratios in IFERROR (for example =IFERROR(B12/B20,"n/a")) so a missing figure does not break your summary. Then use conditional formatting (Home › Conditional Formatting › Color Scales) to highlight improving and worsening ratios at a glance.
Step 5: Forecasting
=FORECAST.LINEAR(x, known_y's, known_x's)projects a value from a straight-line trend.=TREND(known_y's, known_x's, new_x's)returns several forecast points at once.- Forecast Sheet (Data › Forecast Sheet) builds a forecast with confidence bounds from a time series in a few clicks.
Treat statistical forecasts as a starting point. In financial analysis, the assumptions behind the numbers (prices, volumes, costs) usually matter more than the trend line.
Step 6: Investment and scenario analysis
| Tool | Use it to | Example |
|---|---|---|
| NPV / XNPV | Value a project’s future cash flows | =NPV(10%,C2:F2)+B2 (B2 is the initial outlay as a negative number) |
| IRR / XIRR | Find the project’s rate of return | =IRR(B2:F2) |
| Goal Seek | Find the input that hits a target | Price needed to reach break-even |
| Data Tables | Show results for many input values | Profit for 5 prices × 5 volumes |
| Scenario Manager | Save and compare best, base and worst cases | Switch scenarios without retyping inputs |
Step 7: Present the results
Summarise the five to eight ratios that matter most on one dashboard sheet. A line chart for growth trends, a clustered column chart for margins by year and a simple table of ratios with conditional formatting tell the story faster than pages of numbers. See our guide to which chart to use when.
Frequently Asked Questions
Is Excel good enough for professional financial analysis?
Yes. Excel remains the standard tool in corporate finance, FP&A, banking and audit. Larger teams add Power Query and Power BI for data preparation and reporting, but the analysis itself is usually still done in Excel.
What is the difference between horizontal and vertical analysis?
Horizontal analysis compares the same line item across periods (growth). Vertical analysis compares each line item with a base figure within the same period (structure, such as costs as a % of revenue).
Which ratios matter most?
It depends on the question. Lenders focus on liquidity and leverage (current ratio, debt-to-equity, interest coverage). Investors focus on profitability and returns (margins, ROE, ROA), and managers watch efficiency (asset turnover, receivable and inventory days).
Related guides
- The Ultimate Guide to Financial Modeling PDF
- Top Excel Formulas for Finance Grads PDF
- 31 Top Finance Cheat Sheets PDF
- Excel Cheat Sheet for Accountants PDF
Conclusion
Financial analysis is a critical skill in today’s business environment, and mastering it using Excel can open up a world of opportunities. Whether you seek to refine your current skills or delve into financial analysis for the first time, our PDF document is an invaluable resource.
Download PDF
Ready to elevate your financial analysis skills? Download the PDF now and unlock the full potential of Excel for financial analysis.